


Close
By reframe.food
Behind every variable-rate spray pass, there is a file. Usually a shapefile or a geoJSON, occasionally a proprietary format, sometimes a few hundred rows in a CSV with coordinates and values. That file is the prescription map. It is what the sprayer actually reads.
A prescription map is a picture of a field with a number attached to every point: how much of something to apply here. The something might be herbicide, fungicide, nitrogen, or water. The number might be litres per hectare, grams per square metre, or a binary switch between “spray” and “do not spray”. The geography and the instruction live in the same document.
How does one get made?
The recipe starts with data that describe where the field is not uniform. There are several common sources. Satellite vegetation indices such as NDVI or newer multispectral products sample how green and how dense the canopy is at metre-scale resolution. Soil electrical conductivity scans reveal zones that hold water differently. Yield maps from previous seasons record where the crop has historically done well or poorly. More recently, in-field imagery from drones or from the tractor itself picks up weed patches or disease signatures at the leaf scale.
These layers are stacked. The stacking is not trivial. Layers arrive at different resolutions, different dates, different units, and different confidence levels. Someone, usually an agronomist working with software, has to decide which signals matter for the decision at hand and how to weight them.
Then comes the rule. The rule translates a map of conditions into a map of actions. A simple rule might say: where the weed index is above threshold, apply the full label rate, elsewhere apply zero. A more refined rule might say: adjust the nitrogen rate downward in zones where last year’s yield was high and soil conductivity suggests good water retention, but not below the minimum the crop needs. Rules are where agronomy meets software.
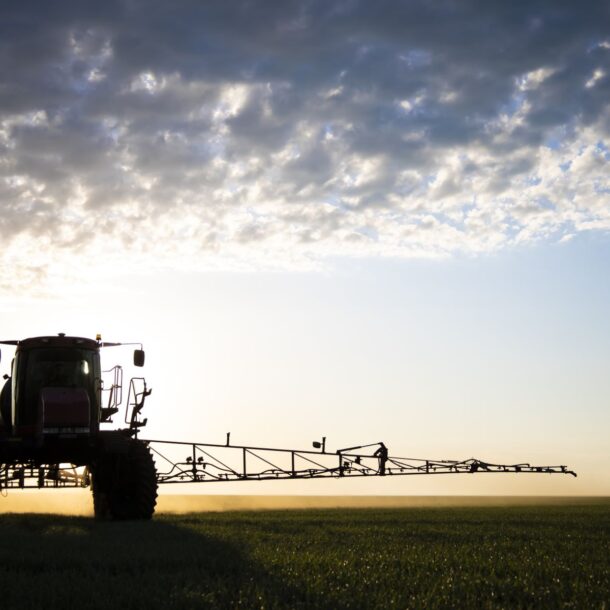
The resulting map is written into a format the sprayer can read, with georeferenced polygons or cells each carrying the target value. It is loaded onto the terminal in the cab, sometimes transferred via USB, increasingly sent over the air. When the sprayer crosses the field, its position is matched against the map in real time, and the boom sections or nozzles adjust accordingly.
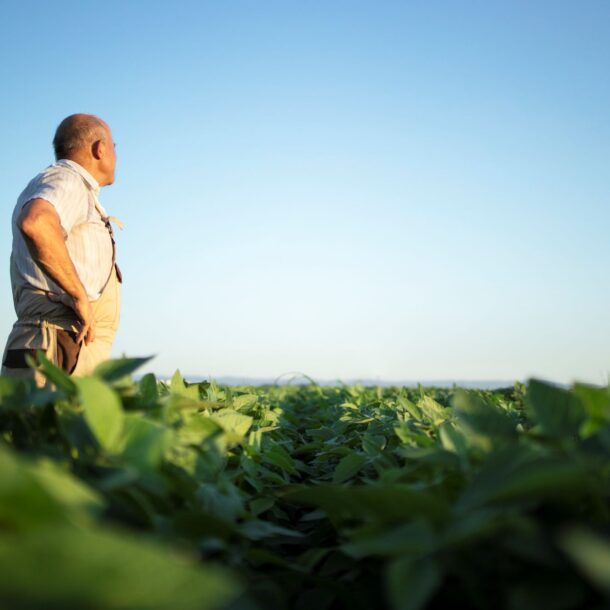
Two things can still go wrong. The map can be right and the physics at the nozzle can fail to execute it, which is why droplet behaviour and calibration remain load-bearing. Or the map can be made from layers that were wrong for the decision, which is why a careful agronomist spends more time interrogating data than drawing polygons.
Projects like Smart Droplets and others in the European precision agriculture community are working on tighter feedback loops, where what the sprayer sensed on the last pass informs the next map rather than waiting for the next satellite image.
A prescription map is not magic. It is a careful answer to a specific question, written in a format a machine can execute. The quality of the answer depends entirely on the quality of the question it was asked to solve.